
REPORTS & DASHBOARDS SOFTWARE
Monitor Business Performance with Interactive Reports and Dashboards
Review key metrics, analyze operational performance and visualize business data through interactive dashboards and structured reports. Xync helps businesses monitor trends, measure performance and make informed decisions with clear, data-driven insights.
- Interactive Dashboards
- Custom Filters
- Business Reports
- Visual Analytics
YOUR BUSINESS IN ONE SCREEN
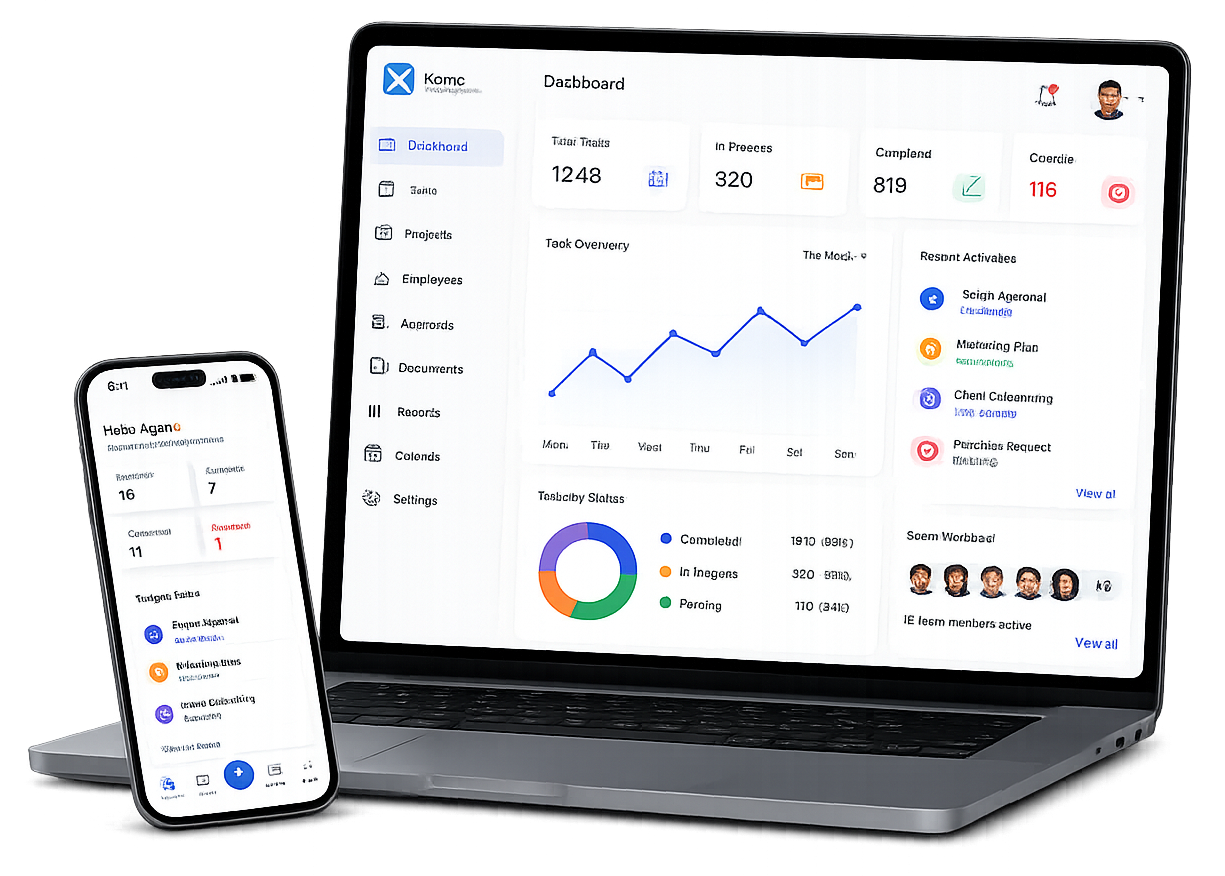
Monitor Business Performance with Real-Time Executive Insights
The Executive Dashboard brings together key business metrics, operational activities and performance insights into a clear, interactive view. Managers and business leaders can quickly review business health, monitor pending work, track performance trends and identify areas that require attention without switching between multiple modules.
Designed to support informed decision-making, the dashboard provides timely visibility into business operations, helping teams respond faster and stay focused on what matters most.
REPORTING & DASHBOARD CAPABILITIES
Everything You Need to Transform Business
Data into Actionable Insights
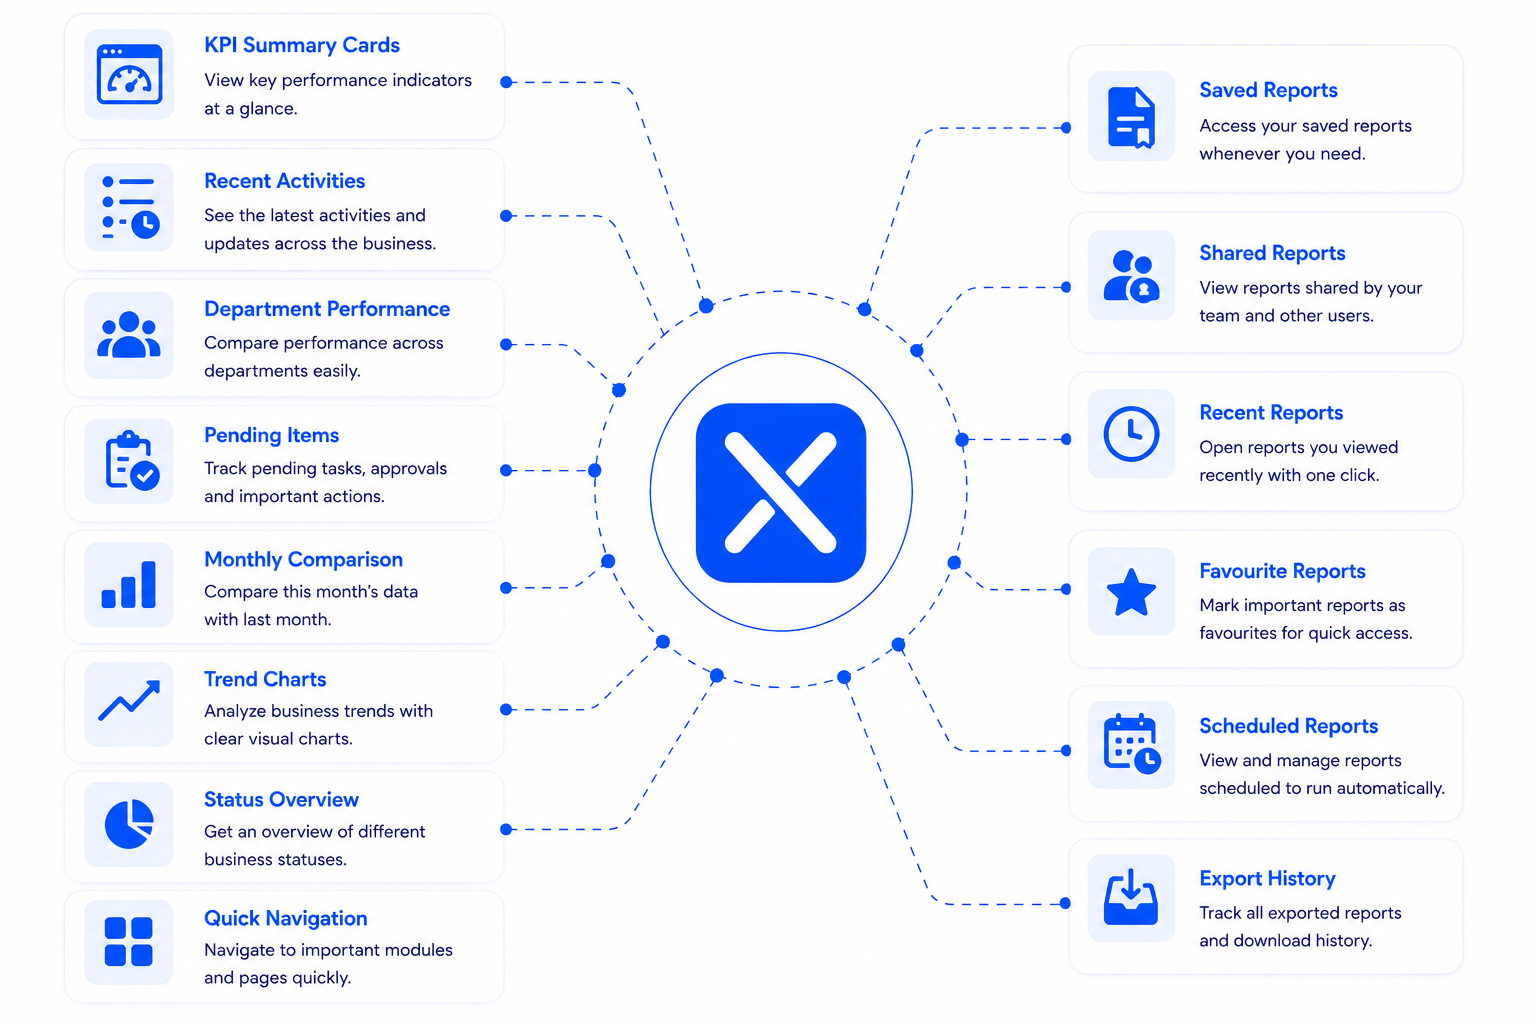
Interactive Dashboards
Visualize important business metrics through charts, graphs and KPI widgets.
Custom Reports
Create reports using selected business information and configurable filters.
Advanced Filters
Analyze information by employee, department, customer, project or reporting period.
KPI Monitoring
Track the performance indicators that matter most to your business.
Visual Analytics
Present business information through meaningful charts and graphical summaries.
Scheduled Reports
Generate recurring reports automatically based on business requirements.
Report Export
Download reports for presentations, meetings or further analysis.
Drill-Down Analysis
Move from summary information into detailed business records for deeper insights.
BUILT FOR MODERN BUSINESSES
Supporting Every Team with Better Task Management
Employee Reports
Review workforce information, attendance and employee activities.
Task Reports
Analyze task assignments, completion status and productivity.
Project Reports
Track milestones, project progress and delivery performance.
Customer Reports
Review customer interactions, sales activities and relationship history.
Workflow & Approval Reports
Monitor workflow performance and approval activities.
Purchase Reports
Analyze procurement requests, purchase activities and vendor records.
Financial Reports
Review financial summaries and business transactions.
Custom Reports
Create reports tailored to your organization's unique reporting requirements.
WHY CHOOSE XYNC
Built for Teams. Designed for Better Work.
Unified Reporting Experience
Consistent Business Metrics
Faster Information Access
Connected Operations
Easy Report Sharing
Built to Scale
Frequently Asked Questions
What is Reports and Dashboard Software?
Reports and dashboard software helps businesses organize data, monitor performance and understand important business information through visual dashboards and detailed reports.
What is the difference between a dashboard and a report?
A dashboard provides a visual summary of important metrics and performance indicators, while a report provides detailed information for deeper analysis.
Can reports be customized based on business needs?
Yes. Reports can be configured using relevant business data, filters and reporting requirements to help teams analyze the information they need.
Can users filter and analyze report data?
Yes. Users can analyze information using available filters such as department, date range, category, status or other business parameters.
Can different teams access different reports?
Yes. Report visibility can be managed based on user roles and responsibilities, allowing teams to access information relevant to their work.
Can dashboards help monitor business performance?
Yes. Dashboards provide a quick overview of key metrics, trends and activities, helping managers monitor performance and identify areas that need attention.
Can reports be exported and shared?
Yes. Reports can be shared or exported based on available permissions, making it easier to use information for reviews, meetings and business analysis.
Is Xync suitable for growing businesses?
Yes. Xync helps growing organizations manage increasing business information by providing structured reports and dashboards across different functions.